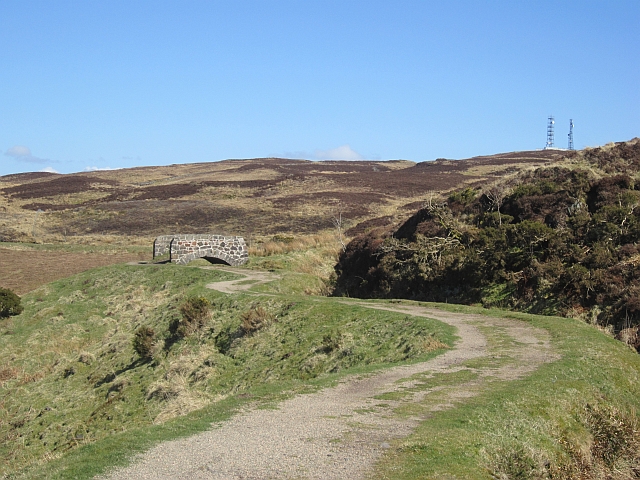
Contour line
Lines joining points of equal value on maps and graphs.

Richard West · CC BY-SA 2.0
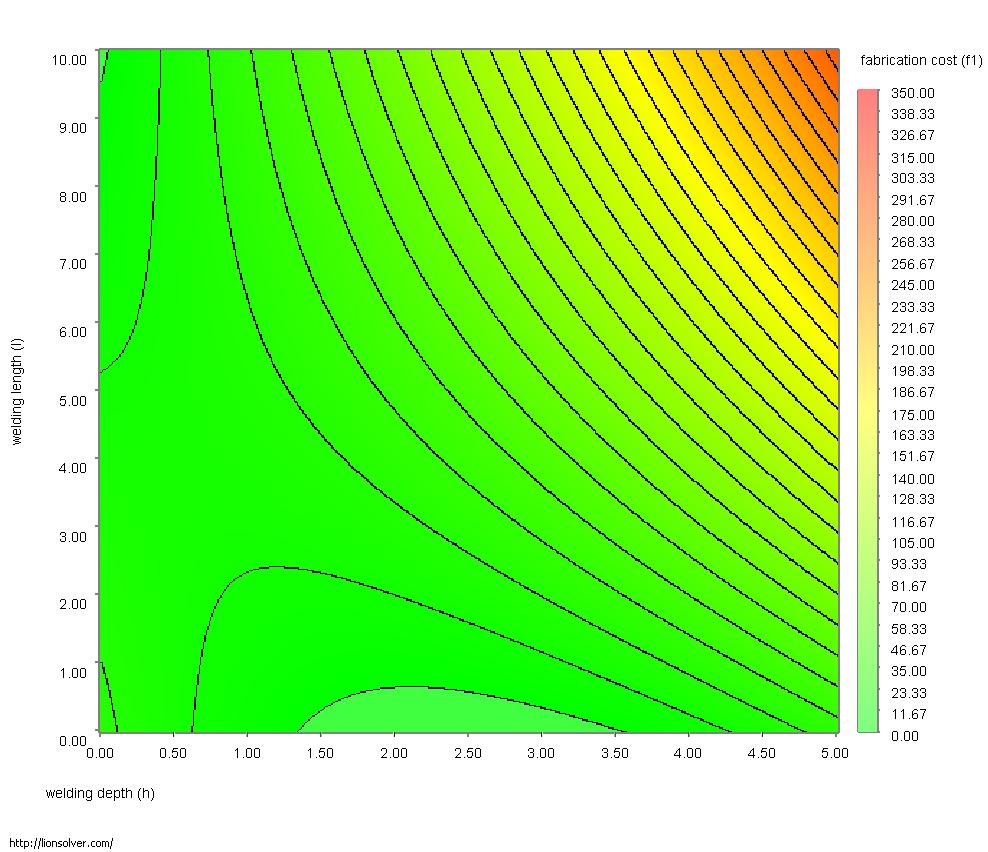
A contour line (also isoline, isopleth, isoquant or isarithm) is a curve along which a function of two variables has a constant value, joining points of equal value. In cartography, a contour line joins points of equal elevation above a given level, such as mean sea level, and is used on topographic maps to show valleys, hills, and the steepness of slopes. The gradient of the function is always perpendicular to the contour lines, and when lines are close together the gradient is large, indicating steep variation.
- earliest_map
- River Spaarne, near Haarlem, by Pieter Bruinsz
- alternative_names
- isopleth, isarithm, isoline, isometric line
Lore & Background
The idea of lines that join points of equal value was rediscovered several times.
Reader's Guide
Contour lines are fundamental in cartography and many scientific fields, allowing the visualization of three-dimensional data on two-dimensional maps. Their significance lies in enabling map readers to infer the relative gradient of a parameter and estimate that parameter at specific places. The configuration of contours reveals valleys, hills, and steepness of slopes. The method of interpolation affects the reliability of individual isolines and their portrayal of slope, pits, and peaks. As different uses were invented independently, cartographers debated what to call these 'lines of equal value' generally. By the early 20th century, 'isopleth' was used in the United States, while 'isarithm' became common in Europe. All these alternatives have survived to the present.
Mathematical Foundation and Geometry
A contour line is fundamentally a curve along which a two-variable function maintains a single constant value, linking together all points that share that particular state. Geometrically, it can be understood as a horizontal slice through the three-dimensional surface of the function f(x,y), cut parallel to the x-y plane. This elegant construction means that every point on the curve represents the same output, regardless of where along the curve you travel. The gradient of the function — the direction of steepest ascent — is always oriented perpendicular to these contour lines, creating a natural geometric relationship between slope and the curve's orientation. When contour lines cluster tightly together, the magnitude of the gradient is large, signaling steep variation in the underlying surface. The concept extends beyond two variables: a level set generalizes the contour line idea to functions of any number of variables, preserving the core principle of connecting points of equal value.
Cartographic Practice and Terrain Reading
In cartography, a contour line — often shortened simply to "contour" — connects points of equal elevation above a reference level such as mean sea level. A topographic map populated with these lines reveals the full three-dimensional character of terrain: valleys, hills, and the steepness or gentleness of slopes all become readable from the pattern. The contour interval, defined as the elevation difference between successive lines, sets the resolution at which the terrain is described. On a map, these lines may appear curved, straight, or as a mixture of both, representing the intersection of a real or hypothetical surface with horizontal planes. The spatial configuration of the contours allows a reader to infer the relative gradient of whatever parameter is being mapped and to estimate that parameter at specific locations. In practice, contours can be traced directly onto a visible three-dimensional model, as a photogrammetrist might do when plotting elevation on a stereo-model, or they can be interpolated from a network of observation points, where the chosen interpolation method directly affects the reliability of the resulting isolines and their portrayal of slope, pits, and peaks.
A History of Independent Rediscovery
The idea of joining points of equal value was not invented once but rediscovered independently across centuries. The oldest known example is an isobath — a line of constant depth — appearing on a 1584 map of the river Spaarne near Haarlem, drawn by the Dutchman Pieter Bruinsz. In 1701, Edmond Halley employed similar lines as isogons on a chart of magnetic variation. Dutch engineer Nicholas Cruquius mapped the bed of the river Merwede with isobaths at one-fathom intervals in 1727, while Philippe Buache applied the technique at ten-fathom intervals on a chart of the English Channel prepared in 1737 and published in 1752. The idea migrated to land surfaces when Domenico Vandelli produced a contour map of the Duchy of Modena and Reggio in 1746. By 1791, J. L. Dupain-Triel's map of France featured contour lines at twenty-metre intervals alongside hachures and spot-heights. When the Ordnance Survey began regularly recording contours in Great Britain and Ireland around 1843, the technique was already well established across Europe, though nautical charts did not routinely adopt isobaths until Russia in 1834 and Britain in 1838.
Naming Debates and the Iso- Classification System
Because the technique emerged independently in so many contexts, cartographers and scientists struggled for a unified vocabulary. Francis Galton proposed "isogram" in 1889, drawing from the Greek isos (equal) and gramma (writing or drawing), though the term can also describe a word without repeated letters. John K. Wright still favored isogram as late as 1944, yet it never achieved widespread adoption. By 1911, "isopleth" (from plethos, meaning amount) was in use in the United States, while "isarithm" (from arithmos, meaning number) had become common in Europe. Additional alternatives such as the Greek-English hybrid "isoline" and "isometric line" (from metron, meaning measure) also emerged. Despite repeated attempts to standardize on a single term, all of these alternatives have persisted to the present day. In practice, specific names beginning with the prefix "iso-" are assigned according to the variable being mapped — isogon for direction, isocline for slope — and the prefix can be swapped for "isallo-" to denote a line where a variable changes at the same rate over a given period. Wright also drew a distinction between isopleths, for variables calculable only from area data such as population density, and isometric lines for variables measurable at a point.
Gallery
Frequently Asked Questions
What exactly is a contour line?
A contour line is a curved line drawn on a map or graph that connects every point sharing the same value of a particular variable. On topographic maps, that value is elevation, so every point along the line sits at the identical height above a reference such as mean sea level.
What do tightly packed contour lines tell you about the terrain?
When contour lines sit close together, the gradient between them is large, meaning the ground rises or falls sharply over a short horizontal distance. This instantly signals a steep slope rather than gently rolling land.
Why do cartographers rely on contour lines instead of just labeling elevations?
By linking points of equal height into continuous curves, contour lines reveal the three-dimensional shape of valleys, ridges, and peaks on a flat sheet. They also make slope steepness immediately visible through the spacing between adjacent lines.
More in Physical Geography & Elevation 1-24
Elsewhere in the Physical Geography & Elevation universe
Spotted an error? Know more?
This is a living reference — every entry is fact-audited, and reader corrections feed straight into our audit queue. Suggest an edit · See this site's audit record